DNMR3 for Windows
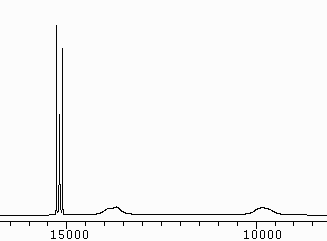
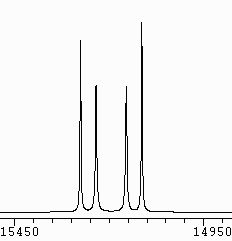
| The DNMR3 plot on the right is a good simulation of an NMR spectrum
at room temperature which we obtained. It is clearly of a molecule
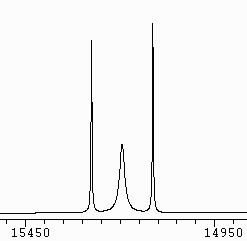
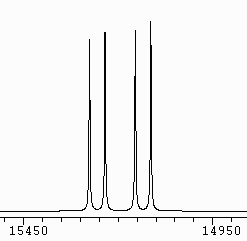
undergoing chemical exchange. The high frequency multiplet, when
expanded, appeared as shown below on the left, whereas it might have been
expected to be the simple doublet of doublets shown below that. The
compound was P3Se4I, which was made by Prof. R. Blachnik's
group at the University of Osnabrueck, and which he sent to the present
author as the first of a series of related compounds for NMR analysis. |
|
 |
|
|
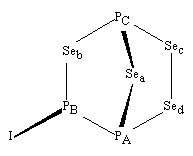
In the chemical exchange, in solution in CS2, the iodine substituent
migrates from PB to PA, as Sed becomes
connected to PB instead of to PA. The result
is that PA and PB exchange their roles, while PC
maintains its role, and the product is the enantiomer of the structure
shown here. Because PC maintains its role, its chemical
shift does not change, and peaks in its multiplet which are separated by
a sum of coupling constants which does not change, remain sharp, as shown
above on the left. |
| The appearance of dynamic NMR spectra depends on the chemical shifts
and couplings constants of the molecule(s), and on the first-order rate
constant(s) of the process at the temperature at which the spectrum is
measured. The first step in analysis is usually to measure another
spectrum, at as low a temperature as is safely accessible for the accumulation
of good quality data. In favourable cases, the exchange may then
be slowed down to the point at which the spectrum resembles that of a static
system, and may be fitted, e.g. by NUMARIT, to obtain the chemical shifts
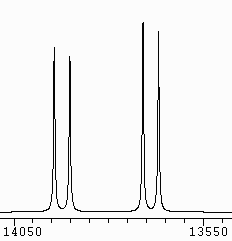
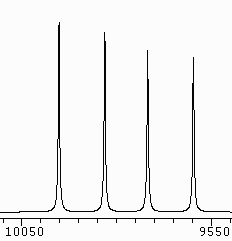
and coupling constants. In the present case, we reached 240 K, when
the PC , PB and PA multiplets appeared
as on the right.
It then remains to find the rate constant(s) for each temperature at
which the spectrum can be measured, when the enthalpy and entropy of activation,
and hence something about what mechanism is taking place, may be found
by fitting the rate constants and temperatures to Eyring's equation.
In cases where there are only broad peaks, for nuclei which change their
roles in the exchange process, as for PB and PA in
the room temperature spectrum at the top of this page, peak shape fitting
software may be used to obtain rate constants, but it is still quite difficult
to produce accurate results. In contrast, in cases such as the present,
where there is a 'spectator' nucleus (PC) it is quite easy to
obtain good results by calculating simulations for a series of rate constants
and then interpolating the observed multiplet structure. For this,
DNMR3 is ideal, as explained in the Introduction
below. |
|
|
|
|
In the present case, further data may be obtained by simulating the
77Se
satellite spectra in the 31P NMR. In the exchange reaction,
when PA exchanges roles with PB, Sea exchanges
its role with Seb. There is a about a 15% chance that
either Sea or Seb will be
77Se (with spin
1/2) while the other will be NMR-inactive selenium. The reaction
will interconvert isotopomer a (with 77Se as Sea)
and isotopomer b. This is a non-mutual
exchange, since a different isomer is produced, whereas the main 31P
spectrum is for a mutual exchange, since
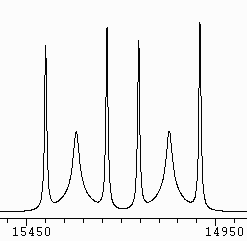
an enantiomer indistinguishable by NMR is produced. A satellite spectrum
for the (isotopomer a / isotopomer b) pair is observed for the PC
atom, in which there are changes with temperature additional to the those
for the main spectrum multiplet. A DNMR3 simulation of this
satellite spectrum at 285 K is shown on the left.
Sec and Sed do not change their roles in the exchange,
and multiplets may be observed for them in the 77Se NMR spectrum
at room temperature, and simulated using DNMR3. Even though Sed
is switching its connection between PA and PB, it
has the same role in either enantiomer. |
Preface
Installation
Introduction
Using DNM3RUN
.nm3 Input Files for DNM3RUN
Using N3PLOT
Setup
History
Preface
DNMR3 by G. Binsch and D.A. Kleier has been useful to us in analysing the
dynamic NMR spectra of several new compounds, and in teaching about dynamic
NMR in undergraduate courses. We now present a new package of Windows
applications for the more convenient use of the original DNMR3 program.
Except for dnmr3.exe itself, which is an almost unmodified translation
of the work of the original authors, the programs have been written by
Dr. Bruce W. Tattershall, Lecturer in Chemistry at Newcastle University,
England.
While other dynamic NMR simulation and fitting programs are available,
some of them as freeware, including at least one implementation of DNMR3
itself, the present suite of Windows programs has been created entirely
by the present author to reflect his preferences and experiences with DNMR3,
as a practising synthetic chemist and spectroscopist.
The package includes a folder of examples, provided both as input files
for DNMR3 and as input files of plots for the new plotting program N3PLOT
for Windows, drawn from the present author's experience of 31P
and 77Se NMR and of teaching NMR analysis as a practical subject
to university chemistry undergraduates.
A file inputfmt.htm is included in
the package, giving the present author's explanation of the format required
in making up input files for DNMR3. The original authors' documentation
was a masterpiece of both accuracy and brevity, but was aimed at users
with an understanding both of dynamic NMR and of Fortran programming.
Platforms
DNMR3 for Windows has been tested under Windows 95, Windows XP and 64-bit
Windows 7
Availability
The DNMR3 for Windows suite of programs may be downloaded as compiled executables
and used free of charge, subject to the Disclaimer
shown below. The two .dll files supplied with the program are proprietary
software, which the author of DNMR3 for Windows is licensed to distribute
with it. If the program is installed as described below under Installation,
there should be no conflict with different versions of these libraries
which you may have received with other software. The source code
for DNMR3 for Windows is not being offered.
Built-in Help
Compiled into both Windows programs of the DNMR3 for Windows suite, there
is extensive help on their use. Most of this help has been combined
to produce the rest of this document.
Installation
Use pkunzip or Winzip or the facilities built in to Windows XP, or whatever,
to unzip the file dnm3we.zip into a programs folder of its own on your
PC. See Warning about Folder Names for Installation
for advice on naming the folder. The folder will contain the
file packlist.txt, which will show what should be present. A folder
called Examples should also have been created, under your programs folder.
Examples contains a file index.txt which explains what is in this folder.
Leave all the .exe, .dll and .bat files in the same program folder,
and do not rename them. Create a separate startup folder, to contain
data files created and used by the suite of programs. Make shortcuts
to the executable files dnm3runw.exe and n3plotw.exe, as described in Setup.
You should read and understand the whole of Setup
before attempting to try out the software, because it does contain some
warnings about the automatic deletion of files in the startup folder.
No further installation under Windows is required. The software
may be uninstalled simply by deleting the .exe, .dll and .bat files.
The file pfe101i.zip is included within dnm3we.zip. This is the
distribution file for Programmer's File Editor, which you may wish to use
for editing input files for DNMR3. See .nm3 Input
Files for DNM3RUN . While the present author recommends
this freeware from Lancaster University, he can take no responsibility
for it. See README.TXT within pfe101i.zip for information about installation
and use of Programmer's File Editor.
Introduction
Using DNM3RUN
.nm3 Input Files for DNM3RUN
Using N3PLOT
Setup
History
DNMR3 for Windows
Introduction
DNMR3 is a dynamic NMR simulation program, written by G. Binsch and D.A.
Kleier, and published in 1977 by the SERC NMR Program Library, Daresbury
DNMR3 simulates dynamic high-resolution NMR spectra of spin systems
with up to four chemical shifts in each of two exchanging configurations,
or up to three chemical shifts when exchanging between three configurations.
-
Unlike DNMR5, DNMR3 lacks an iterative peak shape fitting ability, and
is purely a simulation program
-
It is useful for producing simulations of known systems for teaching purposes,
but in research it is really useful in cases where one or more spin-1/2
nuclei do not change their structural role in the chemical exchange, but
couple to nuclei which do change their role
-
The multiplet due to the 'spectator' nucleus will then contain some sharp
lines and some broadened by the exchange
-
If this multiplet is simulated for a series of rate constants, and the
ratio of the height of a sharp peak to that of a broad peak is measured
in each case, a calibration graph may be constructed relating rate constant
to this ratio. The corresponding ratios, measured in a set of experimental
spectra, may then be interpolated and hence experimental rate constants
may be found for the temperatures of the experiments
-
Judging the position of the baseline for the experimental multiplet and
allowing for any transitions from other spin systems, e.g. from isotopomers,
which overlay the peaks to be measured, are the only serious sources of
error, and good Eyring plots and correspondingly accurate enthalpies and
entropies of activation may be obtained
-
N3PLOT was designed to make it easy to select peaks using the mouse, and
to display their heights
The present version for Windows is a pair of programs:
-
DNM3RUN to run the calculations
-
N3PLOT to display the resulting plots of regions of the simulated spectra,
and optionally to print them or export them to other programs
-
Frequency scales for plots can be specified for DNMR3 and, providing they
will fit onto A4 paper, N3PLOT will produce printouts at these scales,
so that they may be compared exactly with plots of experimental spectra
The two programs communicate with each other by means of a text file, so
they may be run separately, but DNM3RUN can call N3PLOT when it has produced
a file of plots, with automatic running
See History
Using DNM3RUN
.nm3 Input Files for DNM3RUN
Using N3PLOT
Setup
History
History
DNMR3 by G. Binsch and D.A. Kleier was published as Program DNMRL in Fortran
IV for IBM computer systems, by the SERC NMR Program Library, Daresbury,
in 1977.
The present author translated DNMR3 into Fortran 77, and compiled it
as a DOS program for use in PCs in 1991
-
Only the minimum of alterations of were made, to handle character data
using character variables, and to attach files from within the program
-
The format of the plot specification line in the input was changed to resemble
that of NUMARIT, with the same ability to name the plot region, and the
same method of specifying maximum height of the plot
-
The plotting routine was altered to write data to a text file, NM3PLTS.EXT
which was read by a separate program to produce the plots
-
A first priority was to develop a program to display graphical output on
a microcomputer screen, instead of waiting for hard plots to be delivered
by the mainframe service. This became the DOS version of N3PLOT, which
has remained in use until now. When DNMR3 was ported to DOS in 1991, output
in the same standard text file format was retained, so that all plotting
was done via N3PLOT
-
N3PLOT for DOS allowed the measurement of relative peak heights, using
the mouse, greatly facilitating the use of the program to obtain experimental
rate constants for certain kinds of exchanging systems (see Introduction)
-
A version of N3PLOT for DOS with output in HP Graphics Language allowed
output to Hewlett Packard pen plotters and later to laser printers, thus
providing hard copy
-
In 2007 it was decided to rewrite N3PLOT as a Windows application, while
retaining the same file format (and naming) for transfer of data from DNMR3.
N3PLOT for Windows allows free movement between all of the plots generated
by a job, as well as blow-up and peak measurement facilities. Use of Windows
graphical output facilities avoids the use specifically of HPGL, and plots
can be copied as bitmaps directly to other applications, e.g. Word.
-
The present Windows program DNM3RUN is simply a
shell to call the practically unchanged program dnmr3.exe
-
In Version 2, the provided dnmr3.exe has been compiled in MinGW Fortran,
so that it will run in 64-bit Windows 7 or in Windows XP
-
A second copy of dnmr3.exe is provided as dnmr34.exe, as well as the 16-bit
dnmr32.exe provided with Version 1 of DNM3RUN
-
The MinGW Fortran compilation dnmr34.exe will not run in Windows 95 nor
Windows 98
-
In Windows XP or earlier, the user may choose to use dnmr32.exe for the
calculations, as in Version 1, by copying dnmr32.exe to dnmr3.exe. To return
to using dnmr34.exe, which will run in Windows 7, dnmr34.exe may be copied
to dnmr3.exe
-
The rounding errors in dnmr34.exe are slightly different to those in dnmr32.exe,
as a result of the compiler used, even though no changes were made to the
source code for the calculation, between the two versions. As far as the
present author has tested the program, these rounding errors are insignificant.
They are not seen in the graphical output produced by N3PLOT, and do not
change the peak frequencies or peak heights reported by N3PLOT in Measure
mode. Dnmr34.exe produces identical results when it is run in Windows XP
as when it is run in 64-bit Windows 7
-
The present Windows implementation is published by permission of EPSRC,
the successors to SERC, the publishers of the original version
-
DNM3RUN and N3PLOT for Windows are written in Salford ClearWin+ Fortran
90
Introduction
Using DNM3RUN
.nm3 Input Files for DNM3RUN
Using N3PLOT
Setup
Using DNM3RUN
-
Input files for DNMR3 have the file name extension .nm3
-
Some .nm3 files are provided with the programs as examples
-
For the information on preparing .nm3 files, see .nm3
Input Files for DNM3RUN
-
Click the Calculate from File button. A standard Windows file open dialogue
box appears, allowing you to select the .nm3 file required. The DNMR3 run
starts immediately
-
The file open box opens on the startup folder specified in the shortcut
you use to run DNM3RUN, but you can navigate to other folders in the usual
way. If you do so, beware that the temporary file created and destroyed
by DNM3RUN, and its output files, will still be created in the startup
folder, so it is important to set that up appropriately (see
Setup)
-
Because DNMR3 is run by a DOS .bat file, you may have time to see a DOS
window with the message DNMR3 IS CALCULATING ... but this disappears when
the calculation is complete
-
The full textual output from DNMR3, complete with a few IBM printer carriage
control characters, is written to the file NM3PRINT.TXT in the startup
folder, which is copied to a scrollable window in DNM3RUN when the DNMR3
run ends, so that you can see the results immediately, without leaving
DNM3RUN
-
This is overwritten each time DNMR3 is run by DNM3RUN.
-
In the output window in DNM3RUN, text may blocked using the mouse, and
copied to the clipboard using ctrl-C or the Edit Copy menu item.
-
Plot data will be written by DNMR3 to the text file NM3PLTS.EXT in the
startup folder, replacing any previous version. In DNM3RUN, the Display
Plots button will be ungreyed, if N3PLOT for Windows has been installed
in the same program files folder as DNM3RUN (see Setup)
-
Click the Display Plots button to view the plots using N3PLOT
-
The NM3PLTS.EXT file may be saved as an .en3 file from the File Save Plot
File As... menu item in N3PLOT, so that these plots can be viewed later
without having to set up and run DNMR3 again
-
Plots may be printed from N3PLOT, or copied as bitmaps to other Windows
applications, e.g. Word
Introduction
.nm3 Input Files for DNM3RUN
Using N3PLOT
Setup
History
.nm3 Input Files for DNM3RUN
At present, no input file creation facility is being offered for this version
of DNMR3, and a suitable text editor should be used
-
The present author uses a Newcastle University column-oriented text editor
which is now unsupported and not available for distribution, but he suggests
Programmer's File Editor from Lancaster University, which appears to be
eminently suitable freeware, currently available from:
http://www.lancs.ac.uk/staff/steveb/cpaap/pfe
A copy of the distribution .zip file from this web site is included
with the present software.
-
The items on the line are separated by space characters, NOT by TAB characters.
If you are using Programmer's File Editor, set it to use 'Soft tabs' every
5 characters
-
For a full description of the format of the files, see inputfmt.htm
-
The format of the files is as described in the documentation for the original
DNMR3 program, except for the plot line ("Item 7"), which is as follows
-
Columns 1-2
No. of (sets of) rate constants, right justified
-
Columns 11-20
Left frequency limit in Hz, with decimal point
-
Columns 21-30
Right frequency limit, with decimal point
-
Columns 31-40
Frequency scale in Hz per cm, with decimal point
-
Columns 41-50
Height of the tallest peak in the plot, as a fraction of 25 cm. Values
up to 0.6, i.e. 15 cm, are allowed by N3PLOT, with larger values being
reduced to this to allow plotting on A4 landscape paper
-
Columns 51-62
(Optional) title for the plot region, for use in the title bar of N3PLOT
windows
-
If several plot regions are required (for several rate constants), the
.nm3 file should contain the corresponding number of copies of the input
data, one after the other with no blank lines in between them, one for
each plot region desired, but with the plot line differing in each
-
Each of these 'runs' should produce plots for the desired number of rate
constants, though this may be different for different plot regions
-
The maximum number of plots which can be handled by N3PLOT for Windows
is 20, so the sum of the number of (sets of) rate constants over the number
of plot regions should be 20 or less. If this causes a difficulty, the
whole task should be spread over more than one .nm3 file and use of DNM3RUN
and N3PLOT
-
Where several runs for a single chemical system are to be concatenated
in an .nm3 file, the "run number" in columns 1-3 of the first line of each
copy of the data may be the same
Introduction
Using DNM3RUN
Using N3PLOT
Setup
History
Using N3PLOT
-
N3PLOT reads the fixed-name file NM3PLTS.EXT from its startup folder. This
is a text file written by DNMR3
-
The Read Plot File button will appear greyed if NM3PLTS.EXT is not present
in the startup folder
-
To read NM3PLTS.EXT, click the Read Plot File button
-
A window to the right of the screen, headed 'Contents of plot file calculated
by DNMR3' is filled with the data from the file, in a format for reading
by the user.
-
It includes the job title for each job in the original .nm3 file which
has a different 'run number'
-
For each such job it lists, for each plot region, the plot region name
(if supplied in the .nm3 file), the frequency range and scale of the plot,
and the value of T2 used (i.e. 1/(pi * (width at half height)) for a single-transition
peak not broadened by the exchange)
-
N3PLOT creates a graphical plot window for each plot requested from DNMR3
(maximum of 20)
-
The titles (frequency range and rate constant(s)) of the plots) are added
to a drop-down list at the right of the textual tool bar. If the screen
becomes crowded, this may be used to select a different plot from the one
currently selected (although it may not be used to come back from the listing
window or blow up window to the currently selected plot: if it does not
work, click a different plot in the list and then the one you want)
-
On each plot window, there are 'Blow up mode' and 'Measure mode' radio
buttons
-
To blow up a region of a plot, click the Blow up button, then with the
mouse, left drag a rectangular box to enclose the desired region. On releasing
the mouse button, a Blow up plot window appears
-
A blow up plot cannot be blown up further, but it does still have a 'Measure
mode' button
-
Blow up plots cannot be sent to the printer (because the plot has to be
recalculated from data in the file for this), but they can be copied and
pasted as bitmaps to other programs
-
When part of a plot is blown up, the aspect ratio of the selection box
is retained. This means that if you select an area that uses most of the
height of the window, very little magnification will result, because the
blow up plot size will still be limited by the same vertical measurement.
Selecting a smaller height of the plot, as well as less width, will result
in more magnification.
-
Generally, it is better to request a smaller frequency range and fewer
Hz per cm from DNMR3, as a separate plot, than to use the blow up facility
in N3PLOT to an extreme extent
-
The resolution in the blow up plot window is the same as in its parent
window, limiting the precision of peak frequencies obtained in Measure
mode, whereas a plot requested with fewer Hz per cm will have a higher
resolution
-
Measure mode is used conveniently to find the heights of peak tops above
the baseline for a multiplet
-
To use Measure mode, click its radio button in the required plot window
-
Measure mode stays selected only for a single measurement, so if several
measurements are to be made, you need to click the button before each.
This means that you can swap between windows at will when making measurements,
e.g. when comparing peak heights in different multiplets
-
Measurements appear in a permanent window, where they remain for comparison
until another measurement is made
-
They may be selected individually with the mouse and copied to the clipboard
using ctrl-C
This is useful for tabulating peak heights in order to make a calibration
graph of a peak ratio versus log(kr)
-
To make a measurement, click on the plot with either the left or the right
mouse button. A target will be written temporarily on the plot, showing
the position which has been measured
-
If you click with the left mouse button, the target will go to the nearest
frequency on the plot to the point at which you click
-
Generally much more usefully, if you click with the right mouse button,
the target will go to the nearest point vertically on the spectrum. This
means that if you right click moderately accurately above a peak,
the target will drop onto the peak top, giving you a measurement of its
position
-
After each measurement click the Continue button which appears, to remove
the target
-
If N3PLOT is set up appropriately (see
Setup) plots
may be sent to a Windows printer, by means of the File Print Plot menu
item
-
A standard Print dialogue box opens, allowing the selection of a printer,
or of Print to file, and, on clicking the Print button, the whole of the
currently selected plot is printed
-
If the requested plot is 25 cm or less wide, the hard plot should have
exactly the Hz per cm scale requested. Wider plots will be scaled to an
arbitrary scale, so that they fit
-
The maximum peak height is 15 cm in the hard plot. If a greater height
is requested, it will be reduced to 15 cm
-
Whenever there are plot windows on the N3PLOT screen, the currently selected
plot may be copied as a bitmap to the clipboard using the Edit Copy Plot
menu item. From there it may be pasted into Word or Powerpoint
-
While N3PLOT always reads the file NM3PLTS.EXT, stored plot files may be
copied to NM3PLTS.EXT, replacing it, by means of the File Open Plot File
menu item
-
Stored N3PLOT plot files have the file name extension .en3
-
A standard Windows file open dialogue box appears, allowing you to select
the .en3 file required. N3PLOT copies the file to NM3PLTS.EXT and reads
it immediately
-
The file open box opens on the startup folder specified in the shortcut
you use to run N3PLOT (or DNM3RUN, if you are coming from there), but you
can navigate to other folders in the usual way
-
Files copied from other folders will be copied to NM3PLTS.EXT in the startup
folder in use
-
When N3PLOT is called directly by DNM3RUN, it immediately reads the NM3PLTS.EXT
most recently produced
-
To save this as an .en3 file, use the menu item 'File' 'Save Plot File
As...'
-
A standard Windows save dialogue box appears, showing any .en3 files you
have already in the startup folder
-
Either select one of these to replace, or enter the name for a new file,
but without the .en3 file name extension, which will be added by N3PLOT.
N3PLOT copies NM3PLTS.EXT to the file
Introduction
Using DNM3RUN
.nm3 Input Files for DNM3RUN
Setup
History
Setup
-
This software will run in Windows95, Windows XP or 64-bit Windows 7 environments
-
As received, it will run in Windows XP or Windows 7. It must be modified
to make it run in Windows 95 or Windows 98
-
To do this, copy the provided file dnmr32.exe to dnmr3.exe, thus replacing
the provided version of dnmr3.exe. After this modification, the software
will run also in Windows XP, but not in 64-bit Windows 7
-
To reverse the modification, copy the provided file dnmr34.exe to dnmr3.exe
-
The screen resolution should be set to at least 800 by 600 pixels in Settings,
Control Panel, Display. At 800 by 600 pixels, the windows will just fit
on the screen. They do so with space to spare at 1024 by 768 pixels. If
the windows run off the bottom of your screen, you probably have the resolution
set to 640 by 480
-
The library files SALFLIBC.DLL and FTN90.DLL need to be in the windows
path or in the programs folders in which DNM3RUNW.EXE and N3PLOTW.EXE are
stored. These libraries are commercial products, but you are permitted
to take copies of them without charge
-
The provided files DNM3RUN.BAT, N3PRUN.BAT and DNMR3.EXE *** must *** be
in the same programs folder as DNM3RUNW.EXE. See Warning
about Folder Names for Installation for advice on naming the folder
-
If DNM3RUN is to call N3PLOT, the file N3PLOTW.EXE must also be in the
same programs folder
-
DNM3RUN deletes all files with the extension .$$$ in its startup folder
and creates the files NM3PRINT.TXT and NM3PLTS.EXT in its startup folder,
overwriting any previous versions of these
-
*** IT IS ESSENTIAL *** that you start DNM3RUNW.EXE in a folder which does
NOT contain any files which you wish to keep, which have either the name
extension .$$$, or which have either of the names NM3PRINT.TXT or NM3PLTS.EXT
-
Conveniently, the startup folders for DNM3RUN and N3PLOT should be the
same NMR simulation data folder, in which you will keep the .nm3 and .en3
files used by the programs
-
See Warning about Folder Names for Installation
for advice on naming the startup folder
-
To set the startup folders, drag shortcuts for DNM3RUNW.EXE and N3PLOTW.EXE
from Windows Explorer onto your desktop, and rename them DNMR3 and N3PLOT
respectively. Create a suitable data folder. Right click on each of the
two shortcuts in turn, click Properties and alter the Start in: folder
to be your data folder. Apply and OK
-
Under Windows XP, DNM3RUN alternatively may be started by dragging and
dropping a .nm3 file from Windows Explorer onto DNM3RUN's icon. The calculation
will start immediately and the output files will be written to the startup
folder specified in the shortcut
-
If you leave the shortcut to N3PLOTW.EXE with just the program file name
in the target field, N3PLOT started from this shortcut will not allow printing
of plots from the program. This is for use in classroom situations where
extensive printing may not be desirable
-
To start N3PLOT with printing enabled, alter the target field of the shortcut
to it to have a letter P after a space after the .exe file name
-
If the printer to be used has the (common) 300 dots per inch resolution,
it should then work at the correct scale
-
If the printer has a different resolution to 300 dpi, follow the letter
P immediately (no spaces) by = and the number of dpi, e.g. P=600
-
Try a plot requested to be less than 25 cm wide, and check that it is superimposable
on an expansion plot from your NMR spectrometer with the no. of Hz per
cm which you requested. If there is a small error, either in the scale
output by the spectrometer, or in the real resolution of the printer, you
can adjust the P=number parameter in steps of 1, to cure the problem. At
300 dpi you can adjust in steps of 0.033 mm per cm
-
A typical target field would be
... N3PLOTW.EXE P=600
-
DNM3RUN calls N3PLOT via the batch file N3PRUN.BAT so as to provide you
with a mechanism for setting up your use of a printer with N3PLOT
-
As it is downloaded, N3PRUN.BAT will call N3PLOT with no possibility of
printing plots (except by copying and pasting to other programs)
-
If you wish to be able to print plots from N3PLOT called from DNM3RUN,
use Notepad to modify N3PRUN.BAT, following the instructions contained
within it
If, instead of using DNM3RUN as it is provided, you wish to set up your
own scripts for running DNMR3 in DOS, you can see in DNM3RUN.BAT how it
works
-
DNM3RUN.BAT takes two parameters, separated by spaces: the first is the
path to the programs folder, and the second is the full name (including
path if it is not in the startup folder) of the .nm3 file to be used for
input
-
DNMR3.EXE reads the input file INPTONM3.$$$, and writes its textual output
to RAWP.$$$ and its plot data to NM3PLTS.EXT, all in the folder in which
DNMR3.EXE is started
Disclaimer
This software is produced in good faith with the expectation that it will
work well, but neither the author nor the University of Newcastle accepts
any liability for any failure to do so, nor for any damage to other software
or hardware which it might cause. It may not be sold to third parties
nor distributed for financial gain. Any reports on its use should
cite it as:
DNM3RUN and N3PLOT for Windows by B.W. Tattershall, Newcastle University,
Newcastle, England, 2007.
The author makes no commitment to remedy reported bugs or make suggested
improvements, but nevertheless would welcome comments from users.
They should be sent to:
Bruce.Tattershall@ncl.ac.uk
Introduction
Using DNM3RUN
.nm3 Input Files for DNM3RUN
Using N3PLOT
History


