Select the format in which molecular structures are to be shown:
- JSmol requires HTML 5.0, and can be slow
- Jmol requires Java to be installed on the client machine, but is sometimes much faster
Format currently selected: HTML5.0_JSmol
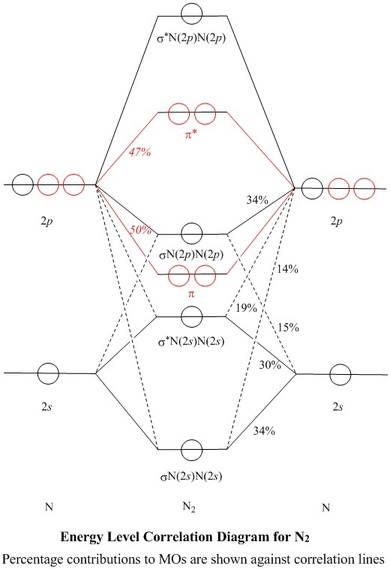
Molecular Orbitals for N2
Jmol models of calculated wavefunctions
To view a model, click in the circle of a molecular orbital in the energy level correlation diagram shown
- Ignore any popup warning and click on the green Continue button which appears
Mouse Control of Models
Left mouse drag to rotate; Shift Left drag up or down to resize;
Shift Right drag or Shift Left drag horizontally to z-rotate;
Right click for menu
Notes
Usage
- The orbitals models are shown in two popup windows, which are reused alternately so that
you can compare one orbital with another
- Contours on a two-dimensional plot correspond to surfaces in three dimensions
- The initial view of a model is with surfaces at ψ = ±0.04
- A radio button is provided to 'Switch contours on'. This shows a
two-dimensional contour plot in the yz plane. This calculation is
slow in the default HTML5.0_JSmol format for the structures:
calculating contours for an orbital takes about 5–10 seconds
in a good browser in a moderately fast PC (in 2018)
- You may see the contour plot better if you 'Switch surfaces off' and click
'Contours coloured'. Black and white contours are provided as the default because
the coloured ones do not show up very well through the coloured surfaces
- If you 'Switch ball and stick off' you can see contours right up to the nuclei,
and where a 2s orbital contributes much you may see its inner lobe with opposite
phase
The Molecule
- N2 is a very stable 10-valence-electron molecule, isoelectronic with
CO and with [CN]–
- The formal bond order of N2 is 3, from about one σ-bond and
two π-bonds
- Its most important property is its lack of reactivity, so that, as the principal
diluent, it can mitigate the dangerous properties of O2 in air
MOs and Natural Atomic Orbitals (NAOs)
| Table of Coefficients and of % of each NAO used,
for each σ–MO |
|---|
| NAO: |
Atom 1 |
Atom 2 |
| N2s |
N2pz |
N2s |
N2pz |
| MO |
coeff. | % used |
coeff. | % used |
coeff. | % used |
coeff. | % used |
| σN(2s)N(2s) |
0.5815 | 34 |
-0.3806 | 14 |
0.5815 | 34 |
0.3806 | 14 |
| σ*N(2s)N(2s) |
0.5491 | 30 |
0.4380 | 19 |
-0.5491 | 30 |
0.4380 | 19 |
| σN(2p)N(2p) |
0.3885 | 15 |
0.5820 | 34 |
0.3885 | 15 |
-0.5820 | 34 |
| σ*N(2p)N(2p) |
0.2476 | 6 |
-0.2605 | 7 |
-0.2476 | 6 |
-0.2605 | 7 |
- The MO models shown on this web page were obtained at the
RMPW1PW91/6–311g(2df) level in a conventional ab initio calculation,
using a Gaussian atomic basis set
- The Gaussian atomic basis set is an approximation to Natural Atomic Orbitals, 2s,
2pz, etc., which are not very amenable to computation
- A Natural Bond Orbital analysis of the resulting MOs produced a set
of NAOs and the coefficients of these needed to make the calculated MOs
- The square of the coefficient, of a NAO in a MO, is the fraction of
the NAO used in that MO
- Most of these squares are shown
as percentages against the correlation lines of the Energy Level
Correlation Diagram
- All of the valence shell NAO contributions
to the σ–MOs are shown in the Table of Coefficients
- Expressed as percentages, all of the AO contributions to a MO should
add up to 100%, and all of the uses of an AO should sum to 100%, since
either an AO or a MO represents exactly one electron
- However, some of the
Gaussian atomic basis maps into core (1s) or higher (3s or 3p)
NAOs, rather than into
valence shell (2s or 2p) NAOs
- While the total of valence shell NAO contributions to e.g.
πy, amounts to 99%, or to
π*y amounts to 95%, the higher energy, empty,
'virtual' MOs are less well accounted for, and consequently are less
likely to be realistic.
Thus, only 26% of σ*N(2p)N(2p)
maps to valence shell NAOs, and the rest to n=3 or n=4 NAOs
- Besides the shortfalls in the total contributions to MOs, the Table
shows also that each NAO is not wholly accounted for. This is
because the rest maps to even higher virtual MOs
Orthogonality of MOs
-
The σ orbitals (black in the Energy Level Diagram)
lie symmetrically across the
π nodes of the πx or πy orbitals
(red), so σ and π MOs do not mix
- Similarly, the πx MO lies symmetrically across
the π node of the πy MO and vice-versa, so
the π orbitals are orthogonal to each other and form a doubly degenerate
set
- In contrast, the nodal planes of the 2pz AOs do not
correspond to an element of symmetry of the molecule, so they do
mix with 2s AOs
- All four of the σ MOs contain both 2s and
2pz contributions from both atoms
The σ System and sp Mixing
These notes may be displayed with or without an explanation of the
values of the LCAO coefficients shown in the Table of Coefficients.
Explanation is currently
off
| Table of Relative Contributions of
Overlaps to Bonding |
|---|
| MO |
Overlapping AOs |
Overlap integral S |
Contribution c1c2S |
Total for MO |
| Atom 1 | Atom 2 |
| σN(2s)N(2s) |
N2s |
N2s |
0.4795 |
0.1621 |
| σN(2s)N(2s) |
N2s |
N2pz |
0.5075 |
0.1123 |
| σN(2s)N(2s) |
N2pz |
N2s |
-0.5075 |
0.1123 |
| σN(2s)N(2s) |
N2pz |
N2pz |
-0.1797 |
0.0260 |
0.4127 |
| | | | |
| σ*N(2s)N(2s) |
N2s |
N2s |
0.4795 |
-0.1446 |
| σ*N(2s)N(2s) |
N2s |
N2pz |
0.5075 |
0.1221 |
| σ*N(2s)N(2s) |
N2pz |
N2s |
-0.5075 |
0.1221 |
| σ*N(2s)N(2s) |
N2pz |
N2pz |
-0.1797 |
-0.0345 |
0.0651 |
| | | | |
| σN(2p)N(2p) |
N2s |
N2s |
0.4795 |
0.0724 |
| σN(2p)N(2p) |
N2s |
N2pz |
0.5075 |
-0.1147 |
| σN(2p)N(2p) |
N2pz |
N2s |
-0.5075 |
-0.1147 |
| σN(2p)N(2p) |
N2pz |
N2pz |
-0.1797 |
0.0609 |
-0.0961 |
- For the three occupied σ orbitals, for each
of the four pairs of
N—N NAO overlaps, their contribution to bonding
c1c2S12 is shown in the Table of Relative Contributions of
Overlaps to Bonding.
S12 is the overlap integral between them calculated in the NBO
analysis and c1 and
c2 are their LCAO coefficients given in the first Table
- The total contribution to bonding of the three occupied σ orbitals
together is 0.3817, or 47.9% of the total bonding including π bonding
- sp mixing puts p character into σN(2s)N(2s),
making it even more stable. It is now by far the biggest contributor to
bond strength at 51.8% of the total bonding
- Without sp mixing, σ*N(2s)N(2s)
would be an entirely antibonding combination of 2s orbitals,
and σN(2p)N(2p) would be an entirely bonding
combination of 2pz orbitals
- With sp mixing, σ*N(2s)N(2s)
becomes more stable, with a 38% N2pz component
- It is still antibonding with respect to its N(2s) - N(2s) overlap,
but bonding with respect to its N(2s) - N(2pz)
overlaps
- Overall it is now slightly bonding, and contributes 17.1% of the σ
bonding, or 8.2% of the total bonding (including π bonding)
- σN(2p)N(2p) acquires antibonding
N(2s) - N(2pz)
overlaps, making it overall slightly antibonding (a contribution of
-12.1% to total bonding)
- The effects of the weakly bonding σ*N(2s)N(2s)
and the weakly antibonding σN(2p)N(2p)
practically cancel out, leaving the bond order at 3
π Bonding
- Each π or π* orbital should have
only a 2p component from each atom, so each of the four
coefficients should be (½)½,
i.e. 0.7071
- In the present wavemechanical calculation, the values found
were 0.7053 for the π orbitals and ±0.6890 for the
π* orbitals
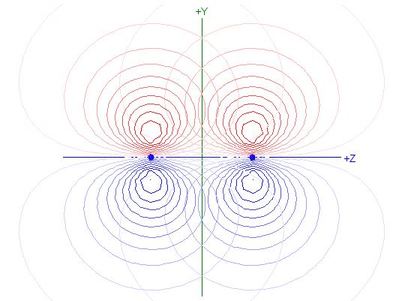
- The overlap integral of 2py orbitals
on atoms 1 and 2 is 0.4178, so the Contribution to Bonding
of this π orbital is 0.2078
- The total contribution of both π orbitals together is
0.4156, or 52.1% of total bonding, including σ bonding
- The π overlap integral is smaller than those for
N(2s) - N(2pz) or N(2s) - N(2s)
overlaps in the σ system (see table), but bigger
in magnitude than the
N(2pz) - N(2pz) overlap integral
- Because the bonding in N2 is dominated by σ
bonding involving s orbital overlaps and by the π
bonding, the equilibrium bond length is such as to favour those
overlaps, but is too short for optimum
N(2pz) - N(2pz) overlap,
as shown in the following contour plot of overlapping 2pz
NAOs for N2:
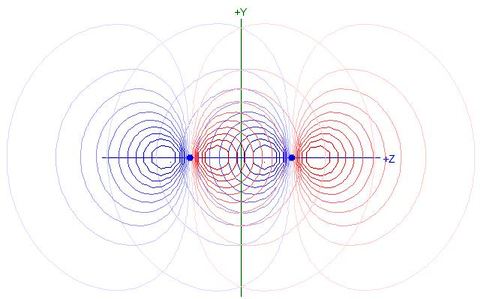
- Each 2pz NAO extends beyond the other nucleus
and hence the nodal plane of the other 2pz NAO
- Products of the two functions in that region are positive, making
the integral less negative
HOMO and LUMOs
- The HOMO of dinitrogen is σN(2p)N(2p)
because the antibonding contribution from sp mixing pushes it
above the π–bonding orbitals in energy
- The LUMOs are the doubly degenerate pair of π* orbitals
- The antibonding nodal surface (approximately the xy
plane) is clearly recognisable in the rotatable model