Analysing the data
In this section, we are going to look at how we can analyse the data from GSE25724.
The GSE25724 dataset contains expression profiles from pancreatic islet cells derived from healthy and type II diabetic patients. These datasets contain a lot of information, and it is not possible to analyse this by 'eye', so therefore we need to use some bioinformatics tools.
The first thing that we need to do is identify which genes have changed expression between the healthy and diabetic samples. To do this, we will use a system called 'geo2r'.
We are going to 'feed' geo2r the dataset associated with GSE25724. This analysis will help us identify genes that show a change in expression between the healthy and the diabetic samples.
- Go to https://www.ncbi.nlm.nih.gov/geo/geo2r/

- In the space next to 'GEO
 accession' type in the accession number that we had retrieved from our earlier search. The number you should type in is GSE25724.
The website should look like this:
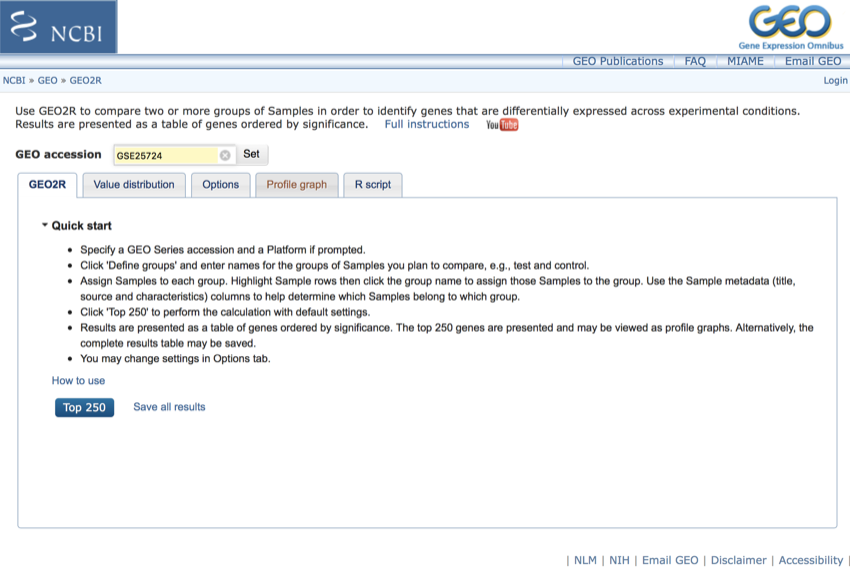
The geo2r website should look like this - Saturday November 11, 2017 at 4:45:42 pm
- Click 'Set'
Once you have clicked 'Set' you should see a page that looks like the following. We now need to select the correct groups for analysis.
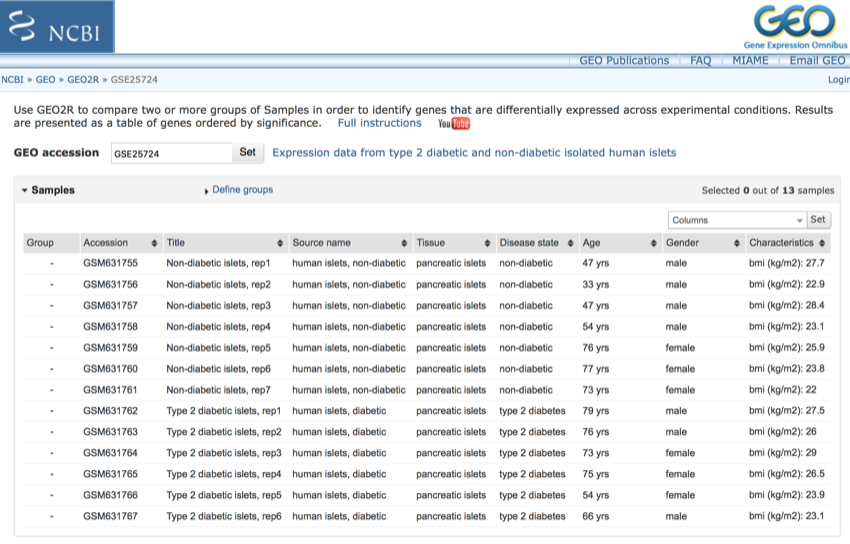
Returned data.
We are now going to define the groups. That is, the groups of 'condition'.
If you look at the data, you will see that we have essentially two main groups, healthy (non-diabetic) and diabetic. There is also some sub-grouping that you could do based on age and sex, and also possibly on body mass index, however, for the purposes of this analysis, we are just going to concentrate on non-diabetic and diabetic.
- Click on 'Define groups'
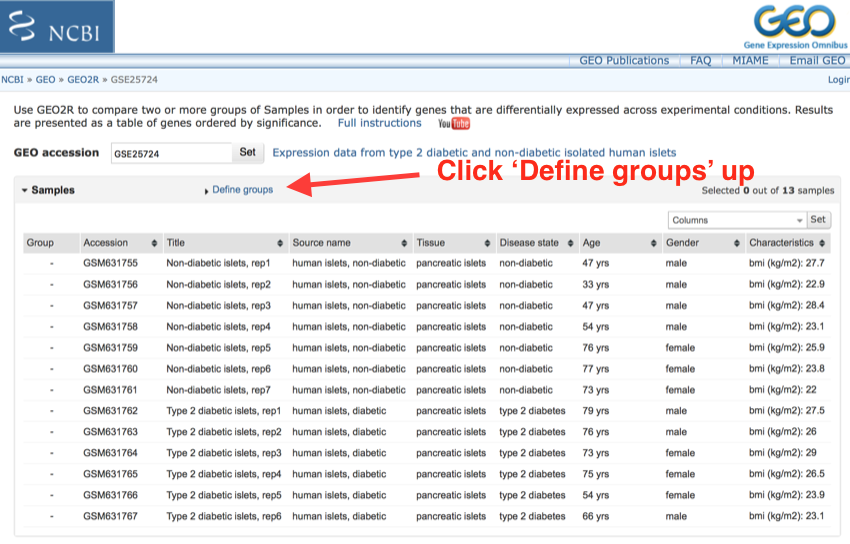
Click on 'Define groups'
Next, you will be presented with a drop-down menu which you used to define the analysis groups.
We will now set up the non-diabetic and diabetic groups.
- In the space provided type 'Diabetic' (you don't need the quote marks) and press return.
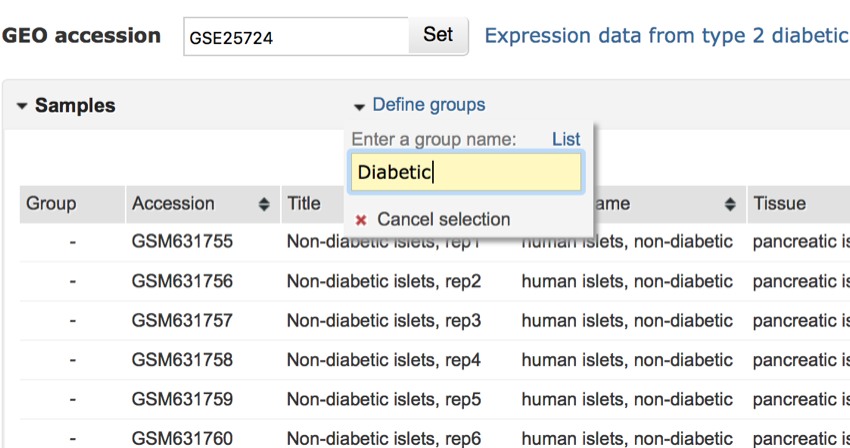
Add the first group to the analysis.
- Repeat the above for 'Non-diabetic'
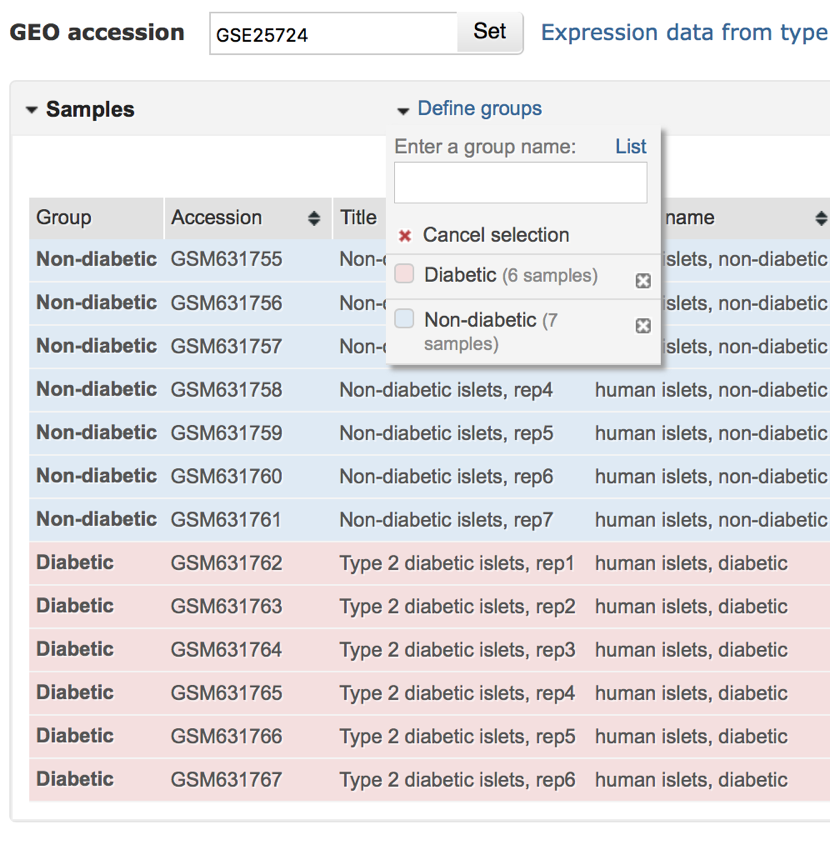
Once you have finished the menu should look like the screen below:
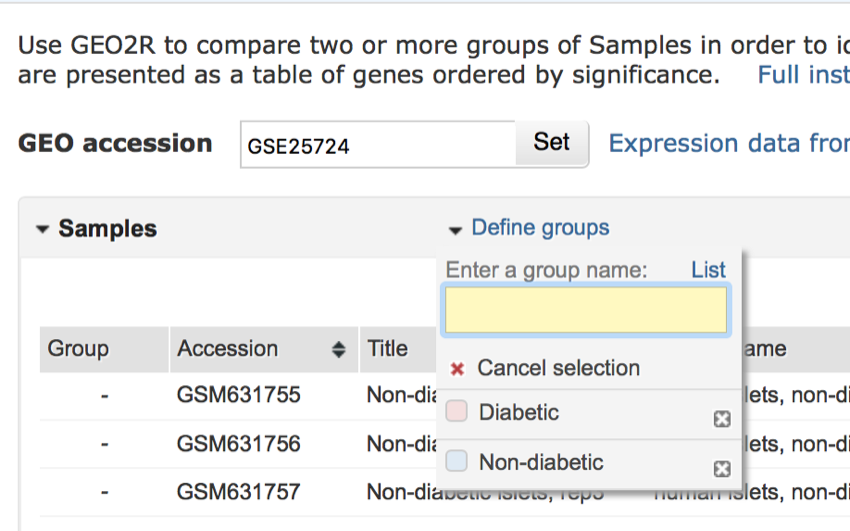
The completed 'Define groups' menu
We are now going to select the data for each group.
- While holding down the shift key click on the accession number of the first non-diabetic sample.
- Repeat this process until all the non-diabetic samples have been selected (see image below)
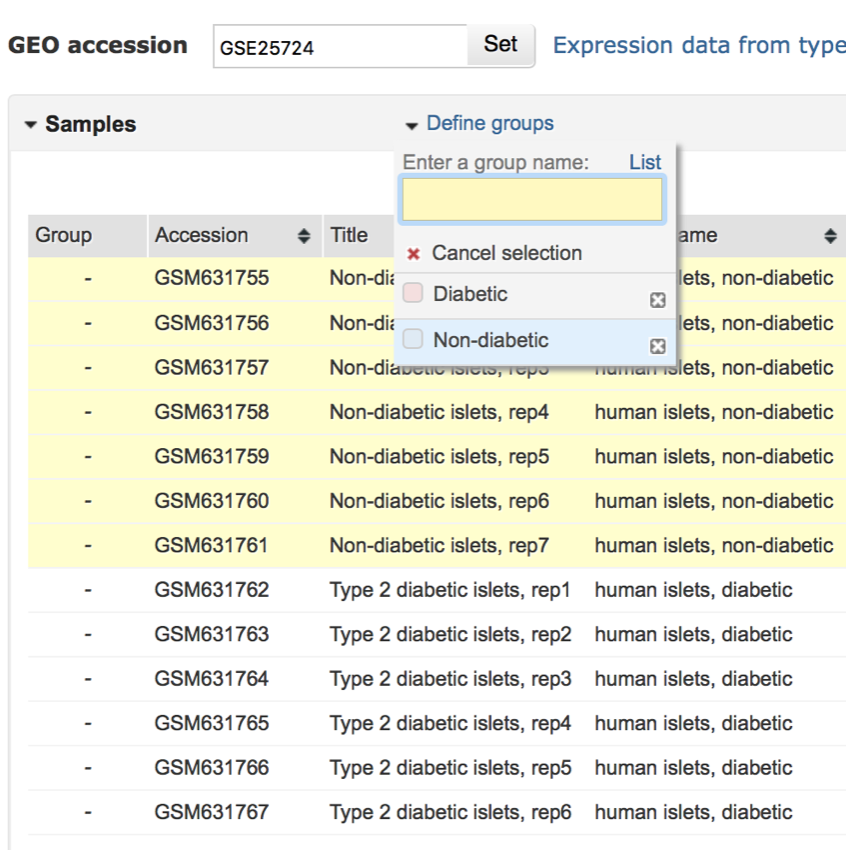
All the non-diabetic samples have been selected.
- Next, click the checkbox next to 'Non-diabetic' in the 'Define group' menu.
- All non-diabetic samples should now be labelled and grouped as 'Non-diabetic' as shown in the image below.
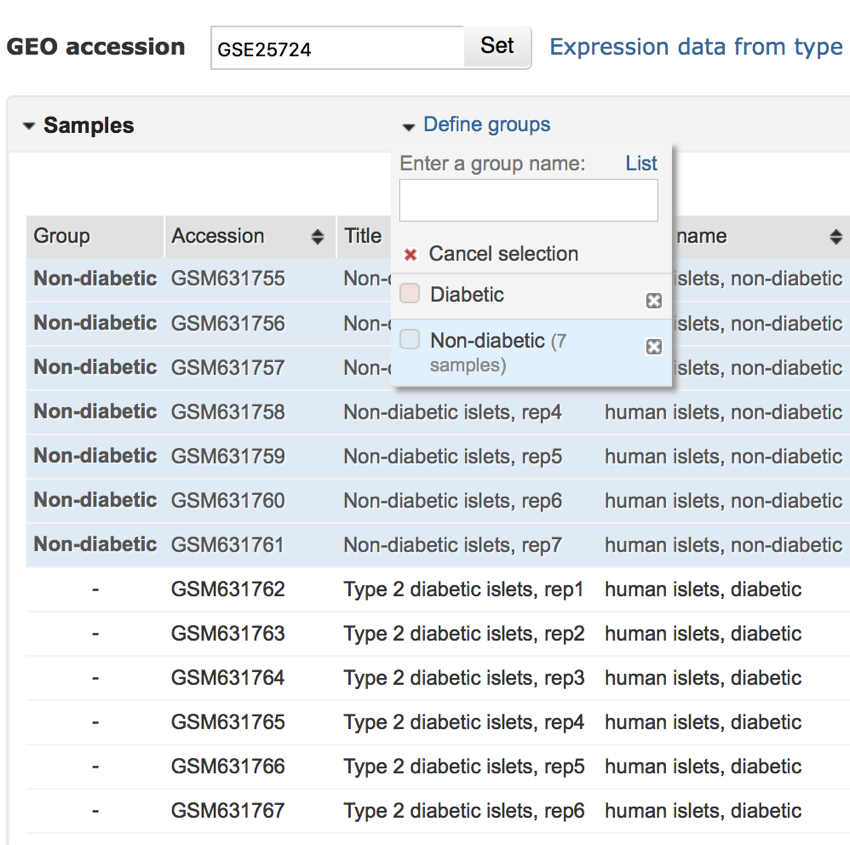
All non-diabetic samples have now been grouped and labelled as 'Non-diabetic'
- Repeat the above process for the diabetic samples.
- Click on the first diabetic sample, and then shift-click on all the other diabetic samples until they are selected.
- Once they have all been selected click on the checkbox next to 'Diabetic' in the 'Define groups' menu
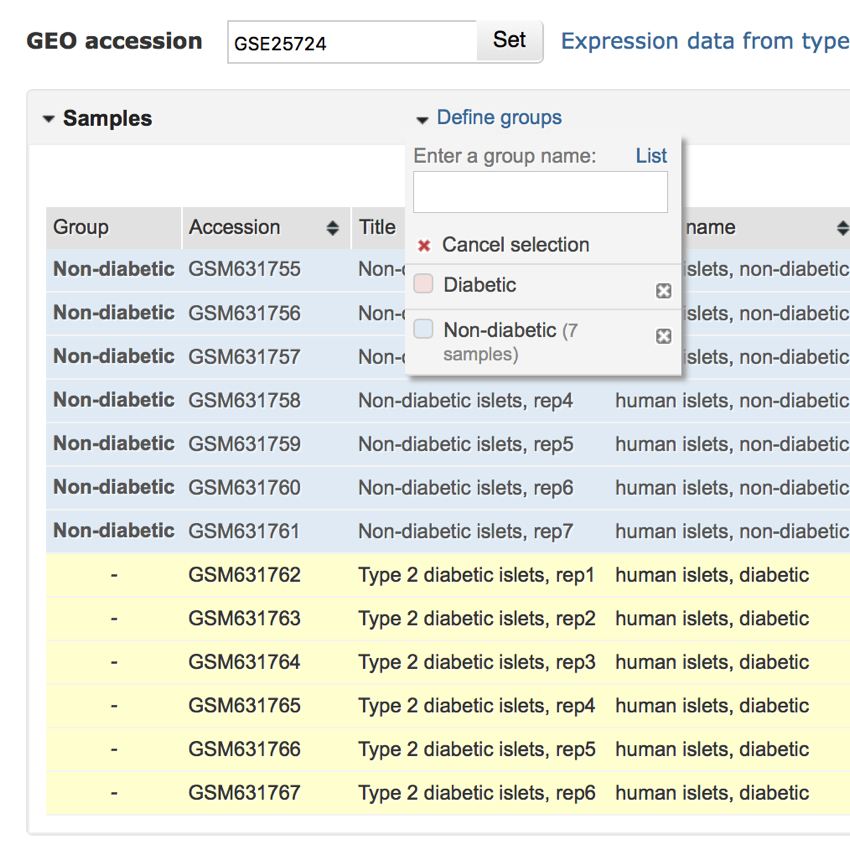
Selecting the diabetic samples.
All the samples of now been assigned to either the 'Non-diabetic' or 'Diabetic' groups.
- Finally, scroll down thew screnn and click the button labelled 'Top 250'.
Be warned! Processing may take some time...