GEO2R results
You have just run an analysis of gene expression data from pancreatic islets of healthy and diabetic humans.
If all has gone to plan you should now have a screen that looks similar to the one below.
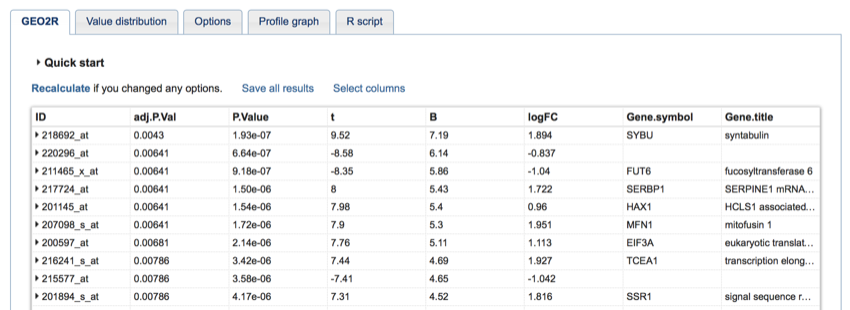
The GEO2R results.
So what does all this mean?
Well...
- ID - This is the Affymetrix ID for the gene. If you click on the small triangle next to the ID, you will see a graph showing a comparison between the nondiabetic and diabetic samples.
- adj.P.Val - This is the adjusted p-value for the statistical difference between the non-diabetic and the diabetic samples. This is the value that we wish to pay attention to as the closer it is zero, the more reliable the data. (More on that later.) The adj.P.Val is calculated by adjusting the p-value to take into consideration the multiple tests that have been performed.
- P.value - this is the raw p-value.
- t - moderated t-statistic (only available when two groups of Samples are defined)
- B - B-statistic or log-odds that the gene is differentially expressed (only available when two groups of Samples are defined)
- logFC - Log2-fold change between two experimental conditions (only available when two groups of Samples are defined)
- F - Moderated F-statistic combines the t-statistics for all the pair-wise comparisons into an overall test of significance for that gene (only available when more than two groups of Samples are defined)
- Gene.symbol - As the name suggests, the symbol for the gene.
- Gene.title - As the name suggests, the name of the gene.
What we need to look at is all the IDs with an adj.P.Val < 0.05. However, to do this, we need to export the data and (believe it or not) open it in Excel!
We are now going to export the data. Unfortunately, this is not a 'pretty' process, and it certainly doesn't seem to be on a Mac. Your experience of this may vary.
- Click on 'Save results'
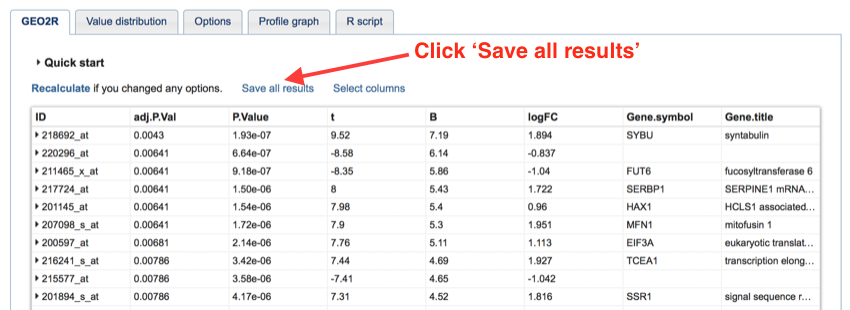
Click on 'Save result'
Your screen will now look like the image below, DON'T PANIC; you haven't broken the Internet, it's just a poorly written website. What you're looking at here is the table from the previous screen expressed as tab-delimited data.
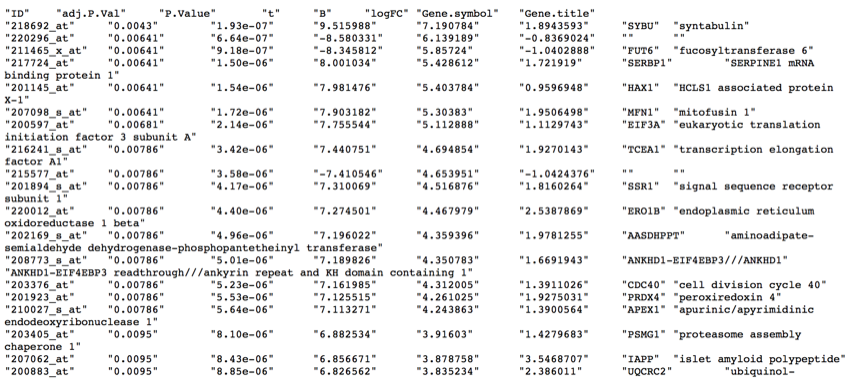
Your analysis results
- Using the browser 'File' menu select 'Save Page as...' and save the page (if it asks format select Text). Give the file a sensible name and the extension .txt and save it so you can find it later.
We are now going to open up the saved file in Excel and extract the IDs we need for further analysis.
- Open Excel.
- Click 'File' and 'Open'.
- Navigate to where you save the file.
- Make sure 'Excel' can see 'All files', that is make sure that 'All file' is showing in the menu in the file open window. If it's not showing, click on the menu and select it.
- In the next window (which is an 'Import Wizard') select 'Delimited', and then click next.
- In the next section make sure that 'Tab' is selected, and then click 'Next'.
- On the next screen make sure that you select 'Text' (this is very important because if you don't select 'Text', then there is the possibility that Excel will 'mutate' all your data as it tries to convert it to dates and numbers).
- Click 'Finish'.
Phew! You should have now successfully imported the data into Excel, the next thing we need to do is sort it. (It most probably is already sorted, but repeating this process is not a bad idea.)
We are now going to select the data to take on further analysis.
- Select column B (the one labelled 'adj.P.value).
- Click on 'Data' in the toolbar.
- Click on the sort ascending button (the little A Z thing with an arrow pointing downwards) to sort the column.
You should now have sorted column B so that the smallest adj.P.value value is at the top.
- Select the second cell in column A (A2).
- Scroll down the page and 'Shift-Click' either the last ID value in column A that has an adj.P.value < 0.05, or 'Shift-Click' cell A1999, whichever comes first.
You should now have selected either all the samples that show a significant difference of adj.P.value < 0.05, or the first 1,998 samples that have an adj.P.value < 0.05.
- Press 'Control C' (i.e. copy the cell data).
You have now selected the data you wish to analyse, so it's time to go and meet DAVID.