Welcome to STRING
As the paper published in Nucleic Acids Res. 2017 Jan 4;45(D1):D362-D368. doi: 10.1093/nar/gkw937. Epub 2016 Oct 18. (
link to Pubmed entry
) says "The STRING database aims to collect and integrate this information, by consolidating known and predicted protein-protein association data for a large number of organisms". Essentially, STRING is a system that brings together a huge amount of information, from multiple sources, for proteins.
You will find STRING useful when pulling together information on a particular protein and how it interacts with other proteins in the cell. You will also find it useful for finding connections between protiens.
You should note that the networks displayed are NOT necessarily physical interaction networks, that is, what is being shown is a 'information' network and that in the cell there maybe many proteins between the two proteins displayed to get the interaction.
In this section, we are going to search for a particular protein (and this may be a protein of interest that you have identified in the assessment) and explore its relationships with other proteins. We will also explore how we can take a group of proteins and see how (if at all) they are connected.
The protein we are going to work with is Insulin Receptor Substrate 1 (IRS1) from humans
- Go to STRING - https://string-db.org
- Click on Search (should be in a box in the centre of the screen)
- In the box provided enter "IRS1" (no quotes)
- Leave Organism set to "Auto-detect"
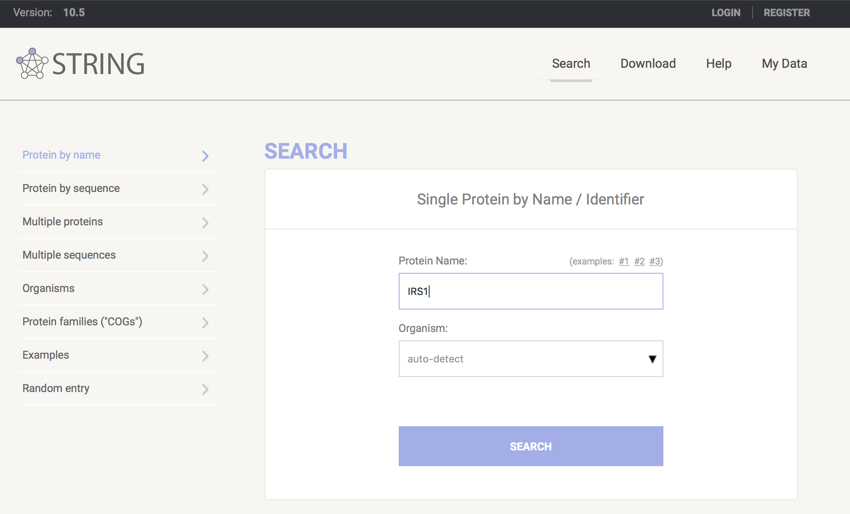
STRING setup
- Click "SEARCH"
- On the next page make sure the correct protein is selected - in this case, IRS1 human.
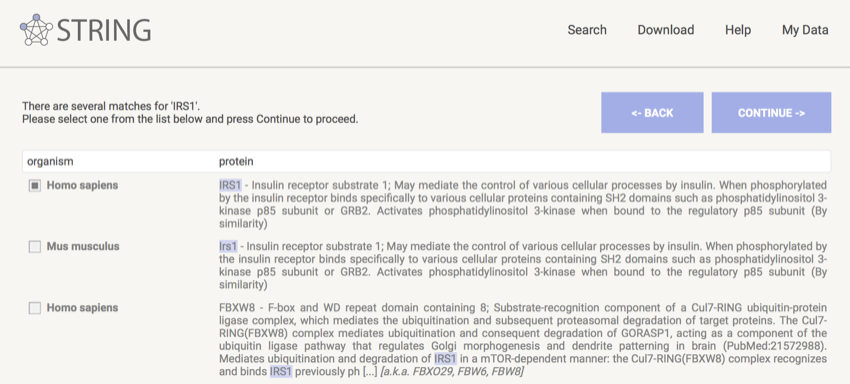
Make sure IRS1 human is selected
- Click "CONTINUE"
You should now be looking at a screen showing a network showing other proteins with which IRS1 interacts.
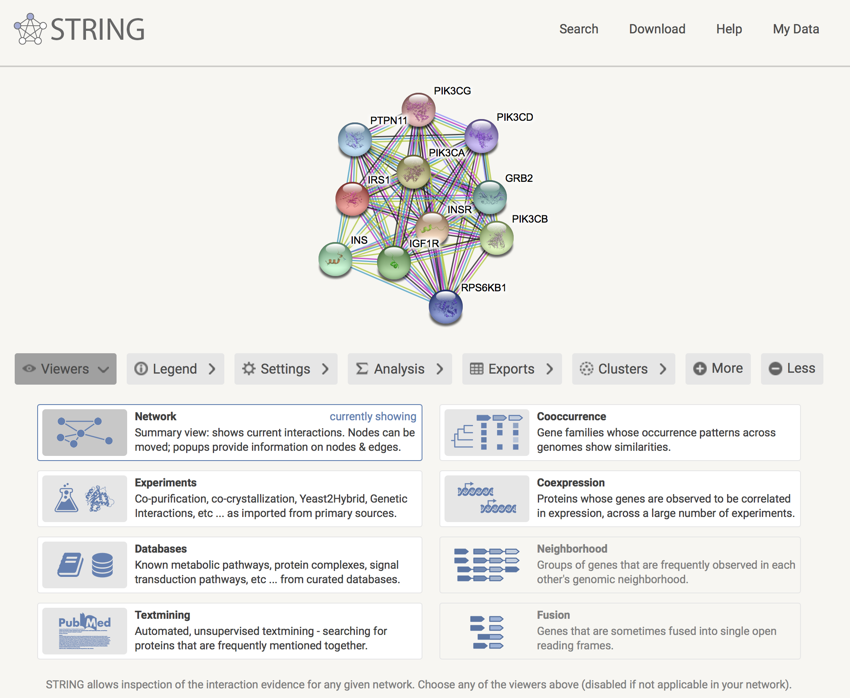
IRS1 protein interaction network
- Click on the IRS1 molecule in the network
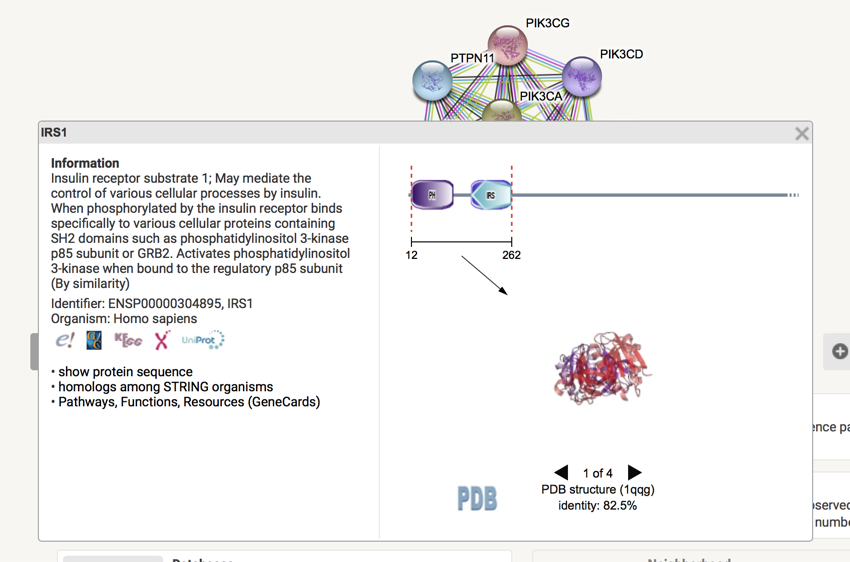
Details for IRS1
From the details that have appeared, you can learn a lot about the protein.
- Click on the different icons (i.e. the E!, KEEG etc.) below the description and review the information presented.
- Click on "Pathways, Functions, Resources (GeneCards)" (last bullet point, doesn't look like it's a link) and review the details on the GeneCards. It is an amazing amount of information.
- Once you have reviewed the information return to STRING and close the IRS1 information window (click the X on the top-right of the IRS1 information window).
We are now going to repeat the above with some of the other proteins.
- Click on the node for INSR (it should be in the middle of the network).
- Review the information associated with the protein.
If you feel the protein network being shown is not large enough then click on the "More" button. If you feel that too much detail is being shown then click the "Less" button.
- Click the "More" button.
- Click the "Less" button (this will take you back to the start view).
- Click the "Less" button; you should now have fewer proteins present.
- Click the "More" button once more to return to the original view.
If you are wondering what all the lines and different coloured balls mean and would like more information on all the proteins, then click the "Legend" button.
- Click the "Legend" button.
The "Analysis" section can reveal some additional information.
- Click on the "Analysis" button.
You can review which proteins are involved in which processes by clicking on the associated terms in the GO, KEGG,
Pfam
and
Interpro tables.
We will now identify the proteins that involved in Insulin Signalling.
- In the "Biological Processes" table click on "GO:0008286 insulin receptor signalling".
All the proteins involved in insulin signalling have now gone red in the network diagram. (To turn off the section click the term again.)
You can continue to explore relationships between the proteins and their function and cellular location etc. by clicking on the terms. If you select more than one term, then different colours will be used.
Finally, let's have a look at how we can get an image for use in a report.
It is possible to rearrange the network to get the view you want.
- Click on the IRS1 node and hold the mouse button down.
- Drag the node to where you want it.
- Open "Analysis" and select some terms of interest.
- Drag the other protein nodes around to get an arrangement that tells the story you wish to tell.
In the image below I selected "GO:0008286 insulin receptor signalling pathway" and "IPR015433 Phosphatidylinositol Kinase" because I am interested in proteins involved in insulin signalling and are members of the phosphatidylinositol kinase family. As can be seen, proteins involved in insulin signalling are labelled coloured blue, those that are members of the phosphatidylinositol kinase family are blue, and members of the phosphatidylinositol kinase family that are involved in insulin signalling are coloured blue and red.

Proteins involved in insulin signalling {blue}, proteins that are members of the phosphatidylinositol kinase family {red}; and proteins that are involved in insulin signalling and are members of the phosphatidylinositol kinase family {red and blue}
Once you have rearranged your network, you can export it.
- Click on "Export".
- Click on download in "as a bitmap image: download file format is 'PNG': portable network graphic" (Note: if you are downloading to use in your report then select the next option down and download at 400 dpi - it'll print better)
In this section we have looked at STRING and how we can use it to explore relationships between proteins. This tool could be used to explore the relationship between any proteins you find in your analysis of the dataset.
In the next section we are going to look at how you might explore these relationships when you have identified more than one protein.