Comments on which browser to use
A web page allowing multiple related molecular structures to be compared
https://teaching.ncl.ac.uk/chemmodels/structs/thiiraneinsrt.php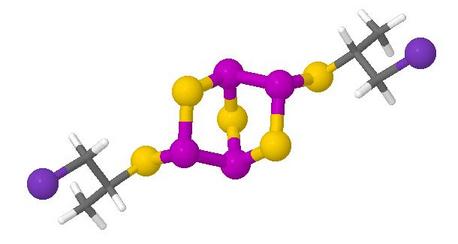
This is supplementary information for a published paper
Ab initio calculations of geometry were done for diastereomers of four compounds and at two levels of theory: 24 structures in all
The compounds have organic ligands attached to a chiral phosphorus sulfide cage skeleton, and it was desired that users would examine the conformations adopted by the ligands, which may be appreciated only in rotatable models
The web page shows a single table containing a button to present each available model, alongside a formula, an indication of chirality (in notation explained in the paper), a static thumbnail image to help understanding of these, the ab initio calculation level, and the calculated energy
Users might be expected to compare the conformations of two or more models. Clicking on each button produces a separate popup, leaving the web page with the table available in its window for further selection. Users are left to close popup windows which are no longer needed
Each model is loaded by its own Rasmol script file, so the best orientation for the initial view may be set for each. In fact, similar but slightly different orientations are supplied for each model
 The initial web page calls the same .php script to produce all of the models, sending
different parameters in each case. This means that the Jmol programming work needed
to be done only once, and the same set of buttons is provided for each popup window
The initial web page calls the same .php script to produce all of the models, sending
different parameters in each case. This means that the Jmol programming work needed
to be done only once, and the same set of buttons is provided for each popup window
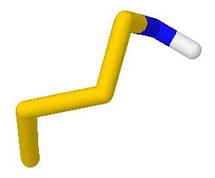
The initial view of each model is a mixed ball-and-stick and stick model, with the two styles enabling the ligands to be seen easily against the phosphorus sulfide skeleton
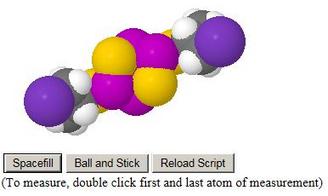
The user could well use the provided Spacefill button to investigate steric interactions. A Reload Script button is provided in case they get lost
Any distance, bonded or non-bonded, may be investigated by double-clicking each atom with the mouse. The unit of measurement is pre-set as Ångstrom units
Users may save all the atomic coordinates using the File, Save item from the menu raised by right mouse click
The index of papers for which such web pages are provided is shown at
https://teaching.ncl.ac.uk/chemmodels/structs
A few of these web pages are visited again below
A web page for teaching showing a series of molecular structures, each with its own presentation requirements
https://teaching.ncl.ac.uk/chemmodels/teaching/ringsandcages/models.php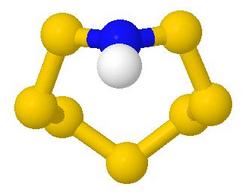
Here there is no intention of users needing to compare one model with another, so to keep the student's desktop clearer, popup windows are not used. The initial window, with its table of molecules, is replaced by the Jmol window, on clicking a Model button in the table
The student can return to the initial web page by using the Back browser button
 Each model on the initial page is associated with a string of single-letter commands
which is sent to the .php script delivering the model. This parses the string
and provides extra buttons as desired for this model, in the order specified by the
string. E.g. in
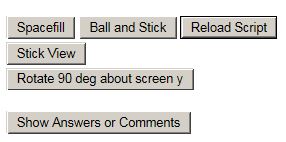
the S7NH example shown, the array of buttons becomes:
Each model on the initial page is associated with a string of single-letter commands
which is sent to the .php script delivering the model. This parses the string
and provides extra buttons as desired for this model, in the order specified by the
string. E.g. in
the S7NH example shown, the array of buttons becomes:
The order of the buttons is meant to suggest to the user a sequence of manipulations
to show an intended feature.
 Thus, 'Stick View' changes the style so that bond
angles may be seen more easily. 'Rotate 90 deg about screen y' turns the model
from the initial orientation which showed the 8-membered ring, to a sideways view in
which the near-planarity of the nitrogen atom can be seen clearly
Thus, 'Stick View' changes the style so that bond
angles may be seen more easily. 'Rotate 90 deg about screen y' turns the model
from the initial orientation which showed the 8-membered ring, to a sideways view in
which the near-planarity of the nitrogen atom can be seen clearly
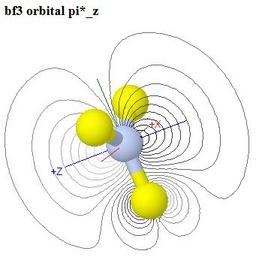
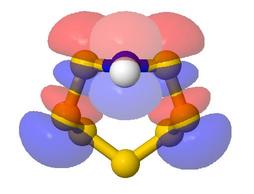 A 'Show Answers or Comments' button is provided for each of the Rings and Cages models.
This pops up a new window in which suitable comments and static pictures are
provided. In this case, pπ-(σ*)π
bonding is considered. The orbital surfaces shown were generated for the same
model using the Jmol stand-alone java application, reading output from a Natural
Bond Orbital calculation done using Gaussian (see below for examples of PNBO or MO
rotatable models produced in this way)
A 'Show Answers or Comments' button is provided for each of the Rings and Cages models.
This pops up a new window in which suitable comments and static pictures are
provided. In this case, pπ-(σ*)π
bonding is considered. The orbital surfaces shown were generated for the same
model using the Jmol stand-alone java application, reading output from a Natural
Bond Orbital calculation done using Gaussian (see below for examples of PNBO or MO
rotatable models produced in this way)
The Answers popup window is reused, if requested, for each new structure, so only one popup window, at most, is used by the Rings and Cages web page
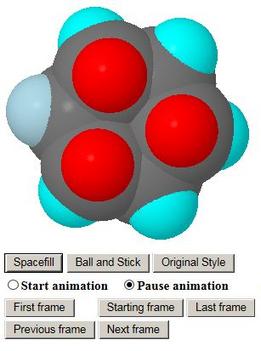
A web page showing an animation of the reaction path of an equilibration reaction
P3Se4I Dynamic 31P NMR Reaction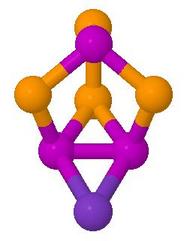
This is another example from the Rings and Cages web page above. In this case, the extra buttons provided include 'Animation Model' and a 'Start animation' and 'Pause animation' pair of radio buttons
The first model to come up is one of the enantiomers of the molecule, which has no symmetry. When 'Animation Model' is clicked, the applet reads a different file of atomic coordinates, containing a concatenation of the coordinates for the 21 frames of the animation. The display changes to the 11th model of the sequence, which is the transition state of the reaction, shown here on the left of the page
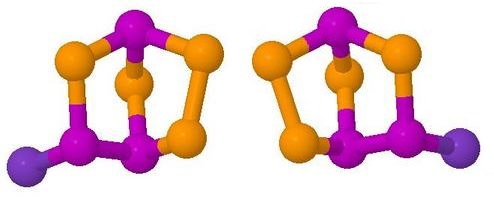
Clicking the 'Start animation' radio button sets the animation in motion, going first to the other enantiomer, then back though the transition state to the first one. The animation goes backwards and forwards between the two enantiomers indefinitely unless paused by the radio button provided. Users may pause at each stable state in turn and satisfy themselves by rotating the model that they are indeed enantiomers of the same compound
The 'Answers and Comments' popup window explains what is happening
Cyclohexane: A web page for teaching showing animations of reaction paths selected on a clickable activation energy diagram
https://teaching.ncl.ac.uk/chemmodels/teaching/structural/cc6/cc6anim.php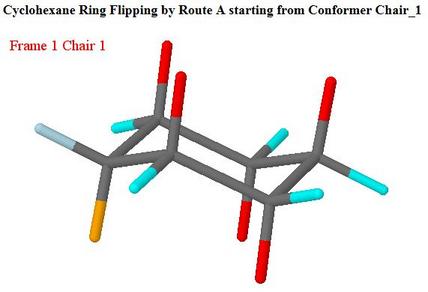
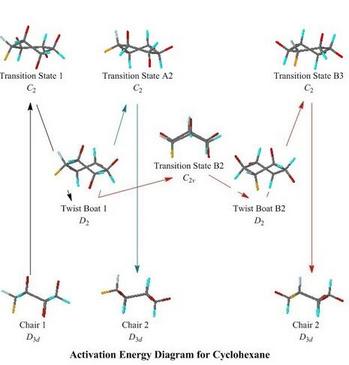
In the animation, above, of the racemisation of the unusual molecule P3Se4I there was just one transition state, so it would be obvious to the user where they were on the reaction route, when the animation was running. For the well-known ring flipping of cyclohexane, although no bond breaking and making is involved, the route is more complex and harder to recognise. Even on the simplest route (here called Route A) there is an intermediate, twist-boat, conformation, and consequently transition states on either side of it
 Instead of starting always at a transition state,
the user is allowed to choose where to
start, by clicking on a thumbnail on an activation energy diagram. Thumbnails
are provided for the chair conformations at the beginning and end of the reaction path,
for the intermediate, and for each of the transition states
Instead of starting always at a transition state,
the user is allowed to choose where to
start, by clicking on a thumbnail on an activation energy diagram. Thumbnails
are provided for the chair conformations at the beginning and end of the reaction path,
for the intermediate, and for each of the transition states
Each model selected opens in a different popup window, up to maximum of two popups,
allowing any two structures to be compared. The popups are then reused in
sequence if other starting points are selected.
Besides 'Start animation' and 'Pause animation' radio buttons, the user
may also choose 'First frame' or 'Last frame', or return to their currently selected
entry point with 'Starting frame'
There is a considerable amount of symmetry, and to appreciate this during the course of the animation, initial viewpoints need to be set carefully. Different optimum viewpoints are set using different Rasmol script files for the two reaction routes, A and B. The script files are used also to colour sets of hydrogen atoms differently, so that the user may follow, e.g., conversion of axial to equatorial substituents during the ring flipping
It would be easy for a user to lose track of where the animation was along the reaction route, so the script files also contain a Jmol data structure containing labels for the possible entry points along the route. As each frame is passed during the animation, this data structure is interrogated and if there is a label for that frame in the data structure, then it is shown in the model window
I became aware of Route B as a result of a web article by H. Rzepa An earlier paper N. Leventis, S. B. Hanna, C. Sotiriou-Leventis, J. Chem. Educ. 1997, 74, 813 showed that there are six possibilities for twist-boat intermediates, connected by untwisted boat transitions states, as in my Route B
BF3: A web page for teaching showing molecular orbitals selected on a clickable orbital energy level diagram
It is best but not essential to be using a browser with a Java plugin when exploring the following link:
https://teaching.ncl.ac.uk/chemmodels/teaching/maingrps/bf3mo/bf3.php
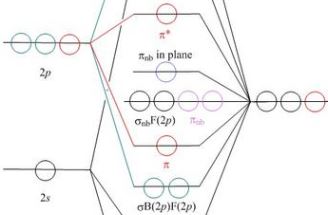 Here it is the orbitals on a schematic energy level diagram (illustrated in part on the left
of the current page) which provide the clickable links to up to two popup windows showing delocalised
molecular orbitals
Here it is the orbitals on a schematic energy level diagram (illustrated in part on the left
of the current page) which provide the clickable links to up to two popup windows showing delocalised
molecular orbitals
The page is intended for students who have taken a course unit on chemical group theory. By default the energy level diagram is presented with point group representation labels. Some students may feel confused by these, so the .php script provides a button for switching these off, leaving just descriptive labels, as commonly used by inorganic chemists and some textbooks
The models come up as a ball and stick model of the geometry, with a surface at ψ = ±0.04 for the selected orbital, coloured blue and red to show relative signs of the wavefunction
A radio button is provided to switch on a contour plot in the plane of the screen in the initial view. For each orbital the direction of view is selected so that some useful contour plot is visible if the contours are switched on
The contours are initially black, so that they show through the translucent orbital surface. A button is provided to switch the surface off, so that the contours may be better seen, when a further button to show coloured contours becomes useful
Finally, buttons switch the ball and stick model off or on. This enables students to see, in a coloured contour plot, the inner lobe of opposite sign produced by contribution of a 2s orbital
The orbital models were calculated in a Natural Bond Orbitals run of Gaussian. Besides producing NBOs for display of overlaps (see below), this is also a convenient way of generating the data for delocalised MOs as seen here, as an alternative to using cube files. Jmol loads bf3.40 and recognises it as a NBO data file giving coefficients for delocalised molecular orbitals in terms of the basis set. It then looks for bf3.31, which contains basis set information, and combines the two. The files from the NBO calculation occupy only a total of 25 kB on the web server, to provide data for all of the MOs. The corollary is that the Jmol/JSmol applet does all of the calculation of surfaces, contours etc., which may be why the non-Java JSmol version is slow to load orbital pages of this kind
A corresponding web page for the pyramidal molecule PF3
may be found at
https://teaching.ncl.ac.uk/chemmodels/teaching/maingrps/pf3mo/pf3.php
PF3 versus BF3: A web page for teaching showing a table of corresponding molecular orbitals for the two molecules
https://teaching.ncl.ac.uk/chemmodels/teaching/maingrps/pf3mo/pf3bf3/pf3bf3.php
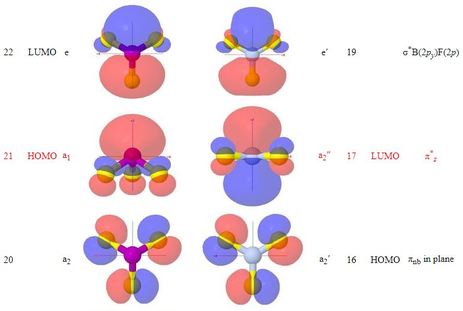
Clicking on a line of the table highlights the line selected
and produces a pair of JSmol applets
which are displayed after the table on a reloaded version of the
page, rather than as popup windows. These show surfaces
at ψ = ±0.04 for orbitals of the two
molecules respectively, which are to be compared
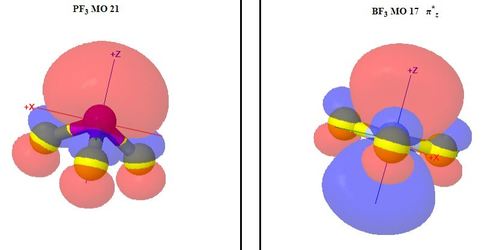
A small amount of JavaScript is used to find the orbital numbers from the table and provide them to the applets
If a different line of the table is then clicked, the models are replaced appropriately
A web page showing lone pair interactions using Natural Bond Orbital models
The link:
https://teaching.ncl.ac.uk/chemmodels/structs/p5e2x.php
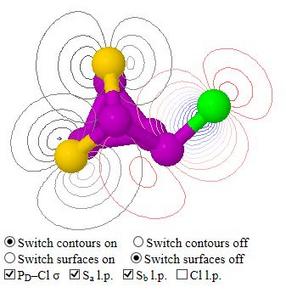
leads to supplementary information for a published paper which included a discussion about through-space lone pair interactions in a non‑bonded triangle of two chalcogen atoms and a phosphorus–halogen unit. These were said to influence bond angles and hence 31P NMR parameters
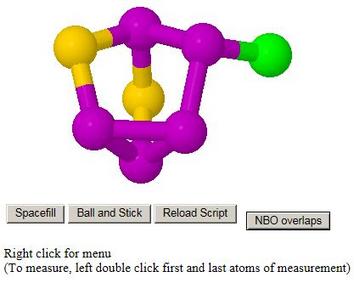
Check boxes allow the selection of a lone pair on either sulfur atom, a lone pair on the chlorine atom, or the phosphorus–chlorine σ‑bonding pair
The orbital data are read as pre-calculated surfaces from files, into four successive frames, one for each of the orbitals to be shown. The check boxes then determine which selection of frames to superimpose to make the visible model. Using pre-calculated surfaces instead of loading data for all orbitals and then calculating contour plots or orbital surfaces for those required, is much quicker, and allows the page to be viewed using a browser such as Chrome which is not Java-enabled, just as well as by using a Java-enabled browser
The orbitals shown are PNBOs, i.e. pre-orthogonal natural bond orbitals, calculated using Gaussian. These look more like the inorganic chemist's concept of localised orbitals than the corresponding NBOs, which have been made orthogonal with each other. This is especially so when the purpose of the model is to show overlaps of the orbitals